- More Website Visits Don't Always Mean Better Marketing
- One Website, Four Marketing Channels, Four Different Stories
- Give Every QR Code Its Own Digital Fingerprint
- What Google Analytics Can Actually Tell You
- A Campaign Report That Changes Your Next Decision
- Build a QR Campaign You Can Actually Measure
- Stop Guessing Which Campaign Works
You printed 5,000 flyers, put QR codes on product packaging, added them to business cards, and placed a few posters around town. A couple of weeks later, website traffic starts climbing. Great news, right? Well, maybe. There's just one awkward question nobody on the marketing team can answer: Which of those campaigns actually brought people to your website?
This is where a lot of businesses hit a wall. They know people are scanning their QR codes, and they can see visitors showing up in their analytics. But when every QR code sends people to the same homepage, the traffic starts looking like one big, anonymous crowd. The poster might be doing all the heavy lifting while the flyers barely get noticed. Or perhaps the packaging is quietly outperforming every other marketing channel. Without proper tracking, you're essentially guessing. And guessing is a pretty expensive way to run a marketing campaign.
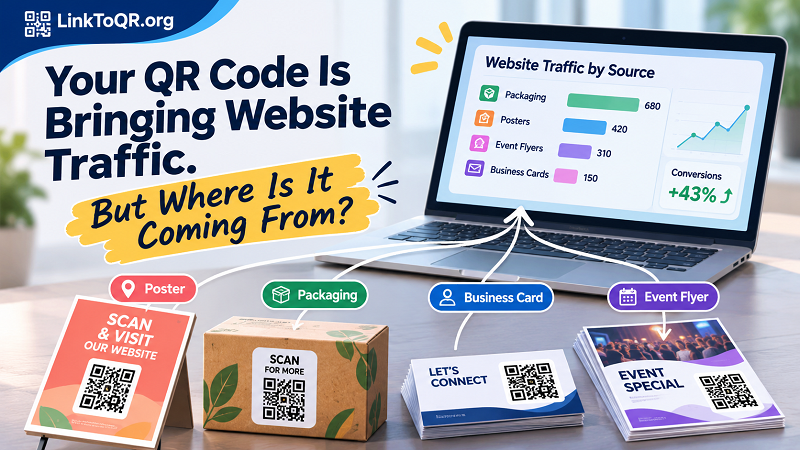
More Website Visits Don't Always Mean Better Marketing
Website traffic is one of those numbers that looks impressive in a presentation. A chart goes up, everyone smiles, and someone says the campaign is working. But traffic alone doesn't tell the whole story.
Imagine your business receives 1,500 website sessions in a week from QR code campaigns. That's a decent result, but what happens next? Did those visitors browse your products, submit a contact form, request a quote, or make a purchase? More importantly, which marketing placement brought them there?
A QR code scan and a website session are not necessarily the same thing. Someone might scan a code but leave before the destination page finishes loading. Another person might scan twice, open the link later, or return through a different channel. That's why it's important to distinguish between scan activity, website visits, and actual conversions.
The real problem isn't a lack of traffic. It's a lack of context. When marketers can't connect website activity to the physical materials that generated it, they struggle to make sensible decisions about where the next marketing dollar should go.
One Website, Four Marketing Channels, Four Different Stories
Let's look at a fictional retail business called Northstar Goods. The company sells consumer products and wants to increase online sales using offline marketing. Instead of relying entirely on digital advertising, it distributes QR codes across four different touchpoints.
The first QR code goes on posters outside its stores. The second is printed on product packaging, inviting customers to explore related products. The third appears on employee business cards, giving potential customers a convenient way to find the company online. The fourth is included in promotional flyers distributed at a local event.
All four QR codes point to the same website. At first, that seems perfectly reasonable. Why create four different destination pages when the company already has a homepage?
But there's a catch. If all four codes use exactly the same URL, website analytics may not tell the marketing team which physical placement generated each visit. The business can see activity, but it cannot easily attribute that activity to a specific campaign.
And these four placements shouldn't be expected to perform equally. Someone scanning a product package may already be familiar with the brand. Someone scanning a poster might be discovering the business for the first time. A person receiving a business card may have already spoken with a sales representative.
Different situations create different expectations. Treating all those visitors as one audience makes it harder to understand what's working.
Give Every QR Code Its Own Digital Fingerprint
Here's the practical fix: use tracking parameters in your destination URLs.
UTM parameters are small pieces of information added to the end of a URL. They help analytics platforms identify where visitors came from and which campaign brought them to a website. They're particularly useful when the original marketing activity happens offline.
For example, instead of sending every QR code to:
https://example.com/
You could create separate tracking URLs:
Store poster:
https://example.com/?utm_source=poster&utm_medium=qr&utm_campaign=summer_promotion
Product packaging:
https://example.com/?utm_source=packaging&utm_medium=qr&utm_campaign=summer_promotion
Business cards:
https://example.com/?utm_source=business_card&utm_medium=qr&utm_campaign=summer_promotion
Event flyers:
https://example.com/?utm_source=event_flyer&utm_medium=qr&utm_campaign=summer_promotion
Notice something important: the destination website stays the same. What changes is the information attached to the URL.
Each parameter has a job:
- utm_source identifies the specific source, such as a poster, packaging, or event flyer.
- utm_medium describes the marketing medium. In this example, it's qr.
- utm_campaign identifies the broader marketing initiative, such as a seasonal promotion or product launch.
- utm_content can distinguish different creative versions, placements, or designs within the same campaign.
You can then turn each tagged URL into a separate QR code. If you're starting with an existing website address, a website link to qr code tool makes it straightforward to convert each tracking URL into a scannable code.
One small detail can save you a lot of frustration later: keep your naming conventions consistent. Don't use BusinessCard in one campaign, business-card in another, and card in a third unless you deliberately want separate reporting values. Analytics tools can treat differently named values as different sources, even when they refer to the same physical marketing material.
A little organization at the beginning is much easier than cleaning up a messy analytics report six months later.
What Google Analytics Can Actually Tell You
Once your tagged URLs are in circulation, Google Analytics 4 (GA4) can help you understand the traffic they generate.
The Traffic acquisition report is a useful place to start. It allows marketers to examine incoming sessions by traffic source, medium, and campaign. With properly configured UTM parameters, you can distinguish visitors arriving through your poster QR codes from those coming through product packaging or event flyers.
But don't stop at the number of sessions.
A campaign generating 800 sessions might look impressive until you discover that almost nobody takes the next step. Meanwhile, another campaign generating just 200 sessions might produce a much higher number of enquiries.
Here are a few metrics worth paying attention to:
Sessions: How many website sessions were attributed to a particular source or campaign?
Engagement rate: Are visitors actually interacting with the website, or are they leaving almost immediately?
Key events: Are visitors completing meaningful actions, such as submitting a contact form, registering for an account, or making a purchase?
Landing page performance: Which pages are receiving traffic from your QR campaigns, and do those pages match what people expected to find?
For businesses with clearly defined conversion goals, these metrics offer a much more useful picture than scan counts alone.
One important distinction: GA4 measures website activity, not every physical QR scan. If you also want to measure scans that never become website sessions, you'll need a QR tracking solution that provides scan analytics separately. The two data sources complement each other, but they answer different questions.
Also, UTM parameters are not a magic attribution system. Visitors may decline analytics consent, block tracking, switch devices, or return through another channel. Campaign reports are useful indicators, not a perfect record of every customer's journey.
A Campaign Report That Changes Your Next Decision
Let's return to Northstar Goods. After running its campaign for a month, the marketing team collects some illustrative GA4 data.
| Marketing placement | Sessions | Leads | Conversion rate |
|---|---|---|---|
| Store posters | 420 | 12 | 2.86% |
| Product packaging | 680 | 41 | 6.03% |
| Business cards | 150 | 18 | 12.00% |
| Event flyers | 310 | 9 | 2.90% |
Note: These are fictional figures created to demonstrate how campaign attribution works, not industry benchmarks.
At first glance, product packaging appears to be the winner. It generates the most sessions and the highest number of leads. That's a strong signal that customers interacting with the product are interested in learning more about the brand.
But the business cards tell a different story. They generate fewer visitors, yet their conversion rate is significantly higher. Why? People receiving a business card may already have had a conversation with an employee. They're not necessarily discovering the company from scratch; they're following up on an existing interaction.
Meanwhile, the posters and event flyers bring people to the website but produce relatively few leads. That doesn't automatically mean they're failures. Perhaps their job is to build awareness rather than generate immediate enquiries. Still, the figures raise useful questions. Is the landing page relevant? Is the call to action clear? Are visitors being given a compelling reason to take the next step?
This is the point where marketing data becomes genuinely valuable. Instead of simply reporting that a campaign generated 1,560 sessions, the team can start asking better questions and making more informed decisions.
Perhaps the company should test a stronger call to action on its posters, keep the packaging strategy, and create a dedicated landing page for people receiving business cards. Those decisions are much more useful than simply printing another batch of flyers and hoping for better results.
Build a QR Campaign You Can Actually Measure
Good tracking doesn't require a complicated marketing department or an expensive analytics setup. It requires a little planning and a consistent approach.
Before launching a campaign, decide what you want to measure. Are you trying to generate enquiries, increase product awareness, drive online purchases, or encourage people to visit a physical store? Your goal determines which metrics matter.
Next, create distinct tracking URLs for the placements you intend to evaluate. You don't necessarily need a different QR code for every individual printed item. You need enough separation to identify the sources that could influence your marketing decisions.
For example, if you have 20 posters distributed across different locations, you might initially use one campaign identifier for all posters. If comparing individual locations becomes important, introduce a separate utm_content value for each location or placement.
Once the URLs are ready, generate the corresponding QR codes and test every one before sending the artwork to the printer. Check that the destination loads correctly on mobile devices, the tracking parameters remain intact, and the landing page delivers the information promised by the printed material.
After distribution, monitor the campaign in GA4. Don't judge performance after just a few hours, especially when your campaign depends on physical materials that may take time to reach customers. Give visitors enough time to interact with the website and complete the actions you're measuring.
Finally, document your naming conventions and campaign URLs in a shared spreadsheet. This might sound like boring administrative work, but it prevents multiple team members from creating inconsistent tracking links and makes historical comparisons much easier.
Stop Guessing Which Campaign Works
A QR code is often treated as the final step in an offline marketing campaign: print it, display it, and wait for people to scan. But that leaves a lot of valuable information on the table.
The real opportunity comes when every scan can be connected to a meaningful marketing source and the resulting website activity can be evaluated against a business goal. That's how a poster becomes more than a printed advertisement, a product package becomes more than packaging, and a business card becomes more than a piece of paper with contact details.
You don't need to track every possible interaction or build an elaborate analytics system overnight. Start with the placements that matter most, give them identifiable URLs, and pay attention to what visitors actually do after arriving.
Because at the end of the day, the most useful question isn't how many people scanned your QR codes. It's which ones helped your business move forward.